The best web designers are like any digital marketers — they make decisions based on data. It can be difficult to achieve an effective web design without knowledge of what did or didn’t work with previous versions. However, figuring out how to derive the most value from your metrics can be challenging.
This is why we worked with Andy Crestodina to create a webinar on the most useful Google Analytics metrics for web designers. Andy, the author of Content Chemistry, combined his knowledge in web design, content marketing, and digital strategy to help our audience better understand how to measure and optimize projects.
In this article, we’ll summarize the main points and takeaways from Andy’s presentation, and share some insights from our Q&A session with him. Let’s get to it!
How to Maximize Google Analytics Metrics as a Web Designer (5 Key Tips)
It’s one thing to use Google Analytics to gather data and insights on your websites. However, the key is understanding how to use those insights to make better design decisions. Let’s take a look at five tips Andy recommends for maximizing your Google Analytics metrics as a web designer.
1. Realize That the Numbers in Your Analytics Are Wrong
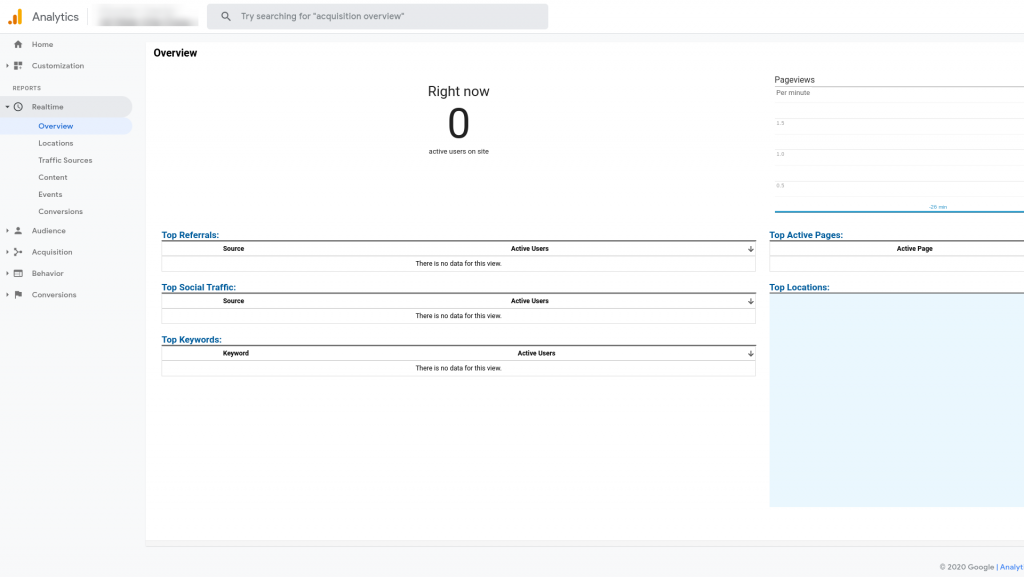
Andy stresses the importance of acknowledging that every number in your analytics is wrong. Not only are visits undercounted, but there’s also a lot of missing data since everything is dependent on JavaScript and cookies.
For example, when a user visits a website, this triggers some JavaScript that reads and writes cookies on the visitor’s device. This enables Google to generate reports that you can access:

Unfortunately, there are major gaps that overlook information essential for web design projects.
Google Analytics is fundamentally based on page views. Non-page view interactions, such as navigating a slideshow, clicking on jump links, or even scrolling, are not automatically tracked. Essentially, if the URL doesn’t change, Google Analytics isn’t aware that something has happened.
The lesson here is that there are a lot of clicks that do not count in Google Analytics. Being aware of this can help you avoid building in critical interactions that don’t actually trigger JavaScript or load a new page, such as an “About Us” section as a pop-up.
Instead, you’ll want to make pages for content. Building pages for everything is good for both analytics and Search Engine Optimization (SEO). After all, Google doesn’t rank websites; it ranks web pages.
2. Optimize Your Web Pages Based on Current Search Performance
Andy explains that it is poor practice to launch a website without first looking up what is getting traction in searches. You might even make the mistake of rewriting a page that’s currently highly relevant.
You can use Google Analytics to do some filtering through your records. Under Acquisition > Search Console, you should see all the pages that are doing well.
Once you have the Search Console set up, you’ll see every phrase each page ranks for. This information can help you determine which pages to migrate to a new site and which to carefully rewrite (if at all). If a page is currently ranked close to the top for a phrase, you have a decent opportunity to rank higher and get your client a better ROI.
This can be done by making that page more specifically focused on the topic the key phrase suggests. This doesn’t require you to do any keyword research. Rather, Google is telling you what pages you should optimize for certain phrases.
Also, pages that rank for one term can also rank for dozens or sometimes hundreds of others. Therefore, you want to optimize for both specific keywords and phrases, which is called semantic SEO. Andy also recommends making your pages more thorough and comprehensive by quoting statistics or adding links that answer questions.
3. Get Rid of Dead Ends in Your User Flow
The fundamental analytic setup task is to create goals. However, once you’ve met a goal, such as acquiring a subscriber, you want to ensure that you’re not ending with a dead-end “Thank You” page.
Rather, your “Thank You” pages could incorporate a Call-to-Action (CTA) and present the user with another opportunity for converting. For example, if they just made a purchase, you might ask them to subscribe to your newsletter.
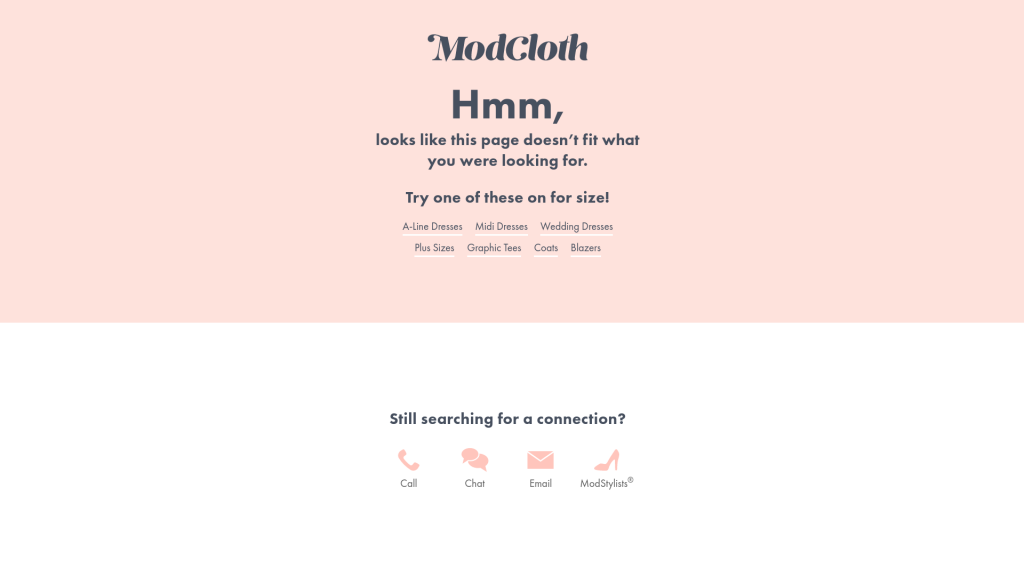
There’s a report in Google Analytics called “user flow”. This phrase indicates that there should be a flow that keeps each user moving through your site. You might do this on your 404 pages by providing a search tool or alternative links to help them get where they want:

Finally, at the bottom of your service pages, be sure to include CTA buttons that require the user to perform an action after they’ve scrolled through your content. Doing so can be an effective way to eliminate unnecessary dead ends and continue the user flow.
4. Use Your Search Box as a Listening Tool
Andy notes that search tools should not just be convenience tools, but also listening devices for figuring out what visitors want. Although most people would rather not have to leave the mouse to type with their keyboard, when they do, you can get useful insights.
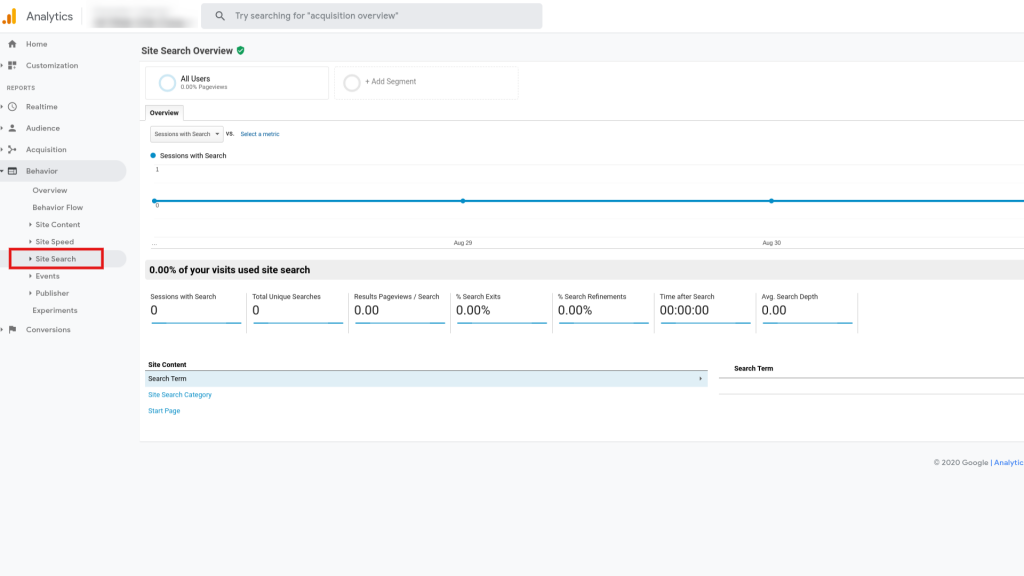
You’ll first need to turn site tracking on. Then, once your data has accrued, you can navigate to Behavior > Site Search and see every phrase typed into your search tool:

A really cool trick here is to use a combination of reports by adding dimensions. For example, you might combine reports from search terms and exit pages.
This can show you the terms people searched for, as well as which pages they left from. For instance, if a user left from the search results page, then they likely didn’t get a relevant result. Essentially, this sort of report can show you everything about your website that is unsatisfying to visitors.
Finally, try using your search tool to look for the same phrases your users search for. This can enable you to have the same experience. Andy calls this “data-driven empathy”. You might discover that a page is not ranking because it’s inaccurately named. You might also find that you don’t have a relevant page for a particular search phrase, in which case you’ve discovered a content gap.
5. Know Your Best Mouse Traps
Knowing which articles are the most compelling requires analysis almost beyond Google Analytics. You’ll need to look at the reverse goal path report to see what people were doing before they converted and landed on a goal completion page.
For example, if your conversion is a newsletter signup, you can see which of your articles people were reading before they made that final step. In general, you want to know which of your pages are likely to achieve a goal such as getting visitors to subscribe. These are your “mouse traps”.
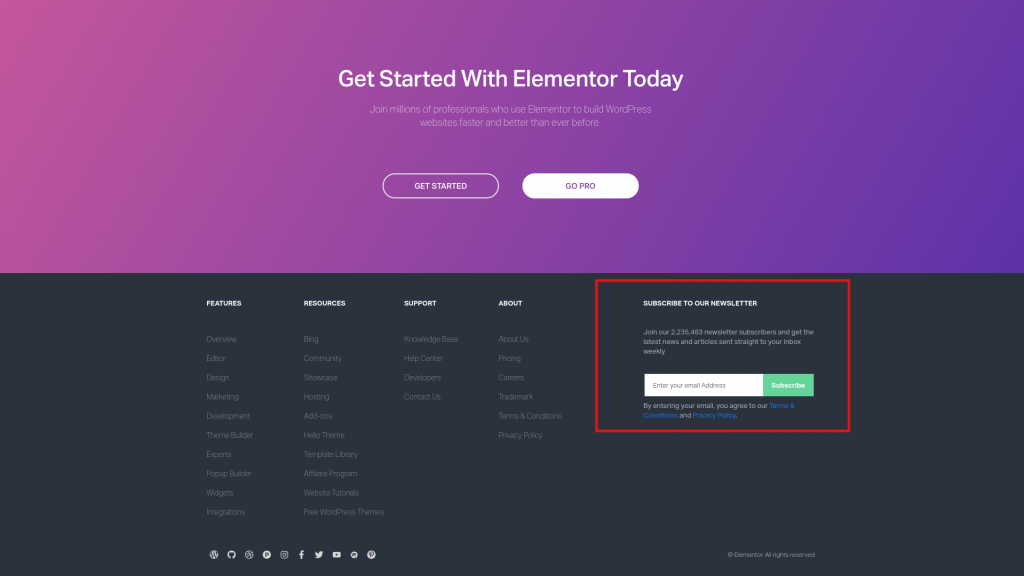
Once you’ve found your best mouse traps, you want to keep them in heavy social rotation and promote them, as well as publish more on the same topic. You’ll also want to make them more prominent. You can put them at the top of your blog, in your email signature, or on your home page:

These mouse traps can be used to grow your email subscriber lists. They also make you less beholden to platforms such as Google and Facebook, because you can directly reach your audience through your email list.
Q&A: Insights from Andy Crestodina on Using Google Analytics as a Web Designer
Before we wrap up, here are some additional insights from our Q&A with Andy.
Q: How frequently do search engines change the way they work?
There really isn’t one version of Google. Most things you do are within an A/B test, and the search algorithm will be adapted based on your actions. Google is evolving rapidly and undergoes changes daily, perhaps several times a day.
Q: How do you establish value conversion when the site is not for e-commerce?
Andy says he sets the value to one for everything. Some marketers try to work backwards from value. If you’re working with clients, you need to interview them to understand figures such as the lifetime value of a customer. You can work backwards from this, and calculate the value of every form submission on average.
Q: How often do you use user conversion rate versus session conversion rate?
Although there is some confusion between these two rates, conversions are, by default, a sessionized metric. The actual definition of a conversion is a session in which at least one goal was met. The conversion rate is the percentage of sessions for which at least one goal was met. In other words, everything in analytics is either a visitor (user) or a visit (session), and conversion rates are based on sessions.
Base Your Web Design Decisions on Relevant Data
Andy’s presentation shed light on the importance of relying on data when making your web design decisions. For more nuggets like this, you can read his articles over at Orbit Media and subscribe to Orbit Media Studios on YouTube. He also recommends the MeasureSchool analytics channel.
In this article, we’ve discussed some tips for effectively using the data you acquire from Google Analytics. They include optimizing your web pages based on current search performance, getting rid of dead ends in your design, using your search boxes as listening tools, and more.
Do you have any questions about using Google Analytics in your web design projects? Let us know in the comments section below!
Looking for fresh content?
By entering your email, you agree to receive Elementor emails, including marketing emails,
and agree to our Terms & Conditions and Privacy Policy.


